US Healthcare Spending to hit $3.8 Trillion in 2014
Dan Munro wrote that annual U.S. healthcare spending will hit $3.8 trillion this year (~21% of GDP).
11/20/2015: Spending actually has stayed mostly flat at about $3 trillion.
There’s good info in his Forbes article and the referenced Deloitte report, but it should not be taken politically one way or another. Centers for Medicare & Medicaid Services (CMS) data shows a slow bending of the cost curve, where the increases in health care expenditures are slowing slightly, the increase is slower than the economy, and it’s slightly slower than in previous years. Still, many of us hope to see costs decline outright, and by a lot.

To me, the real value is recognizing that there are hidden costs not captured in the official 2012 estimate of $2.8 trillion/year. That includes what AARP estimates as a $450 billion burden on unpaid family caregivers because of taking time off from work, foregoing vacations & promotions & other job opportunities, the impact on their own health, and more. But it’s not just those caring for the elderly who bear such burdens. It’s also moms who stay home with a sick child or take off for doctor visits when a telehealth video call should suffice.

So when arguing for health reforms, I prefer to look at the larger $3.8 trillion cost and the fact that Americans spend twice as much as other nations but live sicker and die younger. Surely, we could improve care and still cut expenses in half if we set our minds to it, and if wealthy special interests would get out of the way. But the medical industrial complex spends twice as much on lobbying as the military industrial complex. That’s because cutting half of that $3.3 trillion represents a large loss of revenue that they’d rather go into their own pockets than into strategic public investments in wellness, education, broadband infrastructure, or research.
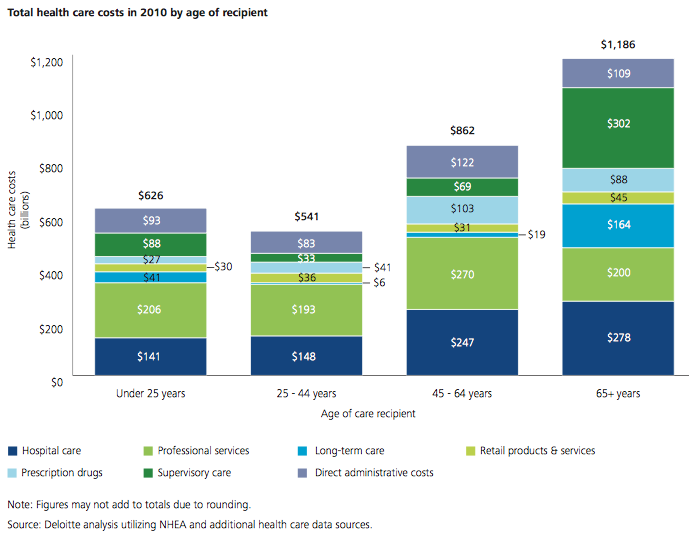
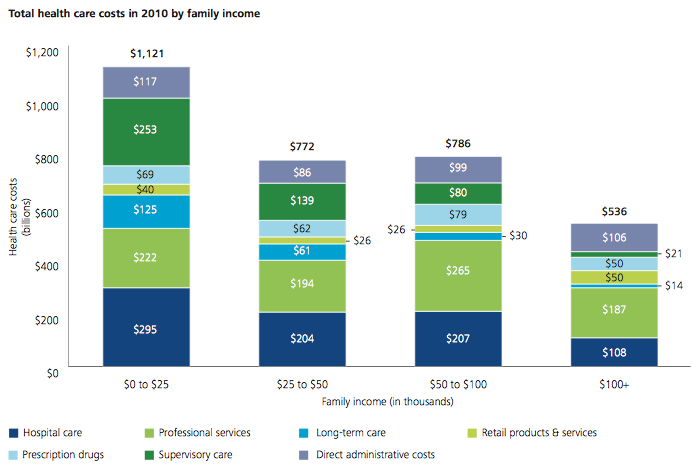
The fact that seniors 65+ spend more on health care is understandable, because they’re more likely to have a chronic illness and need more supervisory care, such as in a nursing home. But the chart below is disturbing. It shows expenditures by family income and causes us to question why. It may be due to having less access to health insurance and preventative care, less access to nutritious foods and safe places to play and exercise, and a greater relics on high-cost emergency departments.
The Family Income chart is consistent with information from HBO’s documentary, The Weight of the Nation, which noted that public health officials have seen differences in average lifespan of more than 20 years between affluent and low-income households on opposite sides of the same town.