Statistics: Problem & Market Opportunity
Of the eleven developed nations evaluated by the Commonwealth Fund, the United States comes in dead last on healthcare.
Are you a family caregiver or a professional?
How much time do you spend, and are you feeling overwhelmed? Caring for elderly parents is a heavy burden placed on the 65 million unpaid family caregivers. Many of them spend more years caring for their parents than a child, an average of 20hrs/wk. In some cases, technology can help, such as remote sensor monitoring and video calls. So I write articles about these technologies here at Modern Health Talk. I also link to relevant market research in our Resources section and pin the best health care infographics on Pinterest on Pinterest.
Back in 2009, AARP put the annual burden on unpaid family caregivers at $480B/year. That included lost worker productivity, reduced earning capacity & retirement income, and increases in their own physical & emotional health and related costs. It’s about 3.2% of the U.S. GDP ($14.1 trillion in 2009), or more than the $361B in Medicaid spending, and nearly as much as the $509B in Medicare spending. It’s also more than half of what we spend on defense. The burden is even worse for long-distance caregivers. These stats are NOT meant to diminish the role of paid caregivers but just to amplify that home health care is a large and growing problem.
What rights do caregivers have? Increasingly society is recognizing the needs for care givers to take care of others, and themselves. Ronnie Friedland, an editor at Care.com, describes caregiver rights, pros & cons of family caregiving, and offers more statistics in Should You Hire Family Members as Caregivers?
Long-term Care Costs (MetLife Survey data, 2012?)
") Below is a long list of Statistics about the health care Problem & Market Opportunity.
Below is a long list of Statistics about the health care Problem & Market Opportunity.
Obamacare was created to address this problem but didn’t go far enough.
Demographics and the Problem of Rising Health Care Costs:
People are living longer and driving costs up
- Life expectancy doubled in the last 200 years and is extending exponentially. This Visual History of Global Health has amazing charts.
- 2000 marked a milestone. There were more people over 60 than children below 5, for the first time. (U.N.)
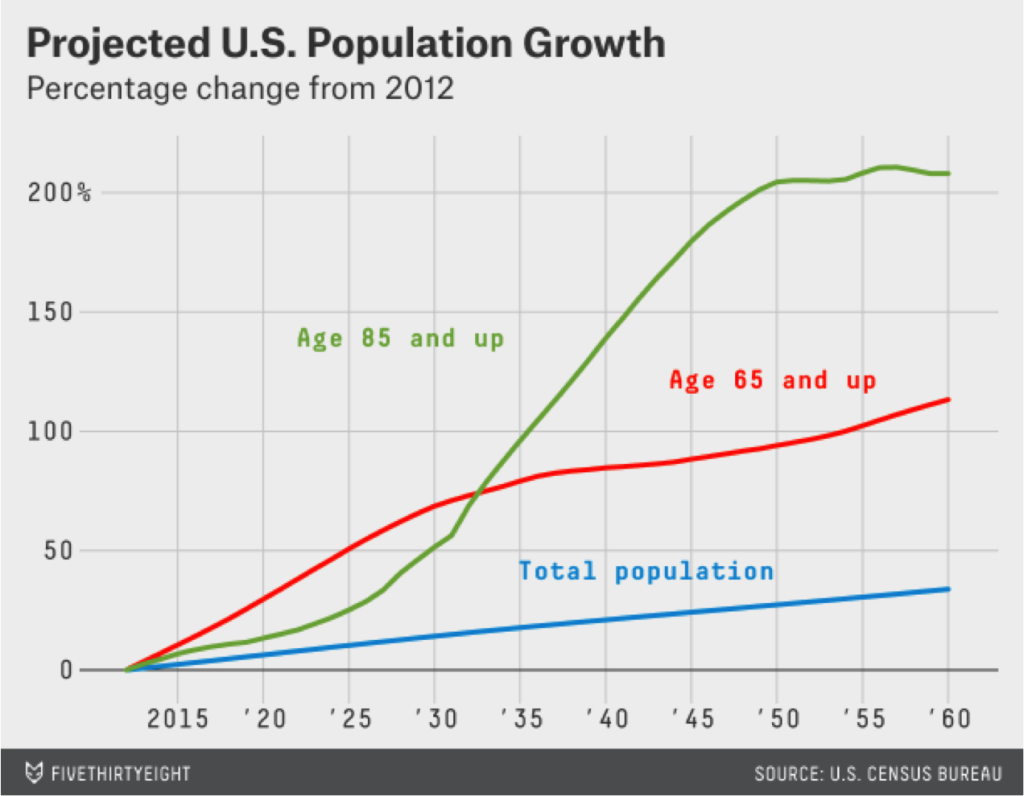
- By 2029, when all baby boomers are 65 years and over, more than 20% of the US population will be over 65 (US Census). That 1-in-5 number is up from 1-in-7 today, meaning 80M people will be 65 or older, up 30M from today.
- By 2035, the first boomers will be in their mid-80s, and 1-in-3 U.S. households will be headed by someone 65 or older.
- The number of HH with a person with a disability will reach more than 31M, an increase of 76% over current numbers.
- 12M of these HH will have someone who needs help with self-care, such as bathing and eating.
- Another 27M will have an occupant who has limitations when it comes to household activities such as driving, cooking, and cleaning.
- Finally, nearly half of all adults will age in low-density places, which may lack public transport or nearby neighbors and services.
- By 2050, the older generation will be larger than the under-15 population. (U.N.)
- In just 10 years, the number of older persons on the planet will surpass 1 billion, an increase of 200M over the decade.
- Today’s young people will be part of the 2 billion-strong population of older persons in 2050. (U.N.)
- 72.1M Americans will be over age 65 by 2030, which is nearly double the number today. (US HHS)
- 81M Americans will be 65+ by 2050. 8.7M will be 90+ and 1M will be 100+ by 2050. (US Census)
- Put another way, by 2050, 20% of Americans will be elderly (65+), up from 12% in 2000 and 8% in 1950 (US CBO)
- Age 85+ is set to grow the fastest over next few decades, equaling 4% of population by 2050, or 10 times its 1950 share (US CBO)
- 2/3 of all people who ever lived to age 65 are still alive today.
- They have better Nutrition, and Technology innovations help extend their lives.
- Despite living longer than previous generations, US boomers are less active and have higher rates of chronic disease and disability.
- Almost 39% of boomers are obese, compared to about 29% in the previous generation.
- 52% of boomers report a sedentary lifestyle, compared with only 17.4% of the previous generation.
- Only 13% of boomers say they’re in “excellent” health, compared to 32% in the previous generation.
- There are already 40M seniors 65+ today, with
10,00011,000 more reaching age 65 every day. - 40% of them are low-income (below 150% of poverty level) and will need public assistance.
- 47% of older men and nearly 24% of older women still work.
- People 90+ had a median income of just $14,760 in 2010, about half of it from Social Security.
- Some 37.3% of people 90+ lived alone, 37.1% lived in households with family or others, 23% stayed in nursing homes, and about 3% lived in assisted living or other informal care facilities. (US Census)
- 1.9 million Americans are now 90+, up from 600,000 30-years ago and 100,000 100-years ago.
- Spending is already out of control vs. health care spending in the rest of developed world:
- Our costs already exceeded $3.65 trillion (in 2018, an increase of 4.4% over 2017, but up to $4.3 trillion by 2021) and are the highest in the developed world.
- That’s about 18% of GDP, going to 19.4% by 2027.
- The U.S. healthcare market is almost half of the $7.6 trillion global healthcare sector.
- Per capita spending was $11,212 in 2018.
- The trend is not good. U.S. middle-income households spent 51% more on healthcare in 2010 than a decade earlier.
- At current pace, costs could reach $13 trillion by 2030 and bankrupt the nation because of Obesity and the 70M Baby Boomers who will soon reach 65, retire, take Social Security.
- The health-care-industrial complex spends more than three times what the military-industrial complex spends in Washington. (TIME Magazine)
- A dramatic new approach is needed, and its urgency is near critical.


- Outcome performance pales by objective metrics, even with all we spend:
- 47th in world ranking for infant mortality (2nd lowest in developed world and even ranked below Cuba!)
- 25th in world for life expectancy (below Chile & Greece – Japan leads)
- Healthcare costs have escalated, yet productivity losses are 5 times greater than the cost of care.
- Health insurance premiums are rising 4-5 times faster than wages and inflation.
- 23% of Medicaid recipients are elderly or disabled, but they account for 64% of spending.
- 70% of nursing home residents are on Medicaid because high expenses deplete their assets.
- Uninsured Americans leave hospitals with unpaid tabs of nearly $50B/year.
- Medical errors are the #6 leading cause of death, killing or seriously injuring ~98,000/year at a cost of $29 B.
- Poor Sleep can cost you more than $8 million in lifetime earning capacity due to its impact on work performance.
- Not getting the recommended 8 hours of sleep can cost you over $700,000 in net worth.
- Sleeping just 6 hours a night increases obesity risk 27%. At 5 hours it’s 73%.
- Sleeping just 6 hours a night can increase your lifetime healthcare costs by more than $300,000.
- Driving drowsy causes 1,550 deaths and 40,000 injuries each year. (National Department of Transportation)
- Prescription Drug Overdoses are the #2 Cause of Unintentional Death, surpassing traffic accidents. (CDC)
- Prescription drug abuse is the fastest growing drug problem in the US.
- 27,000 unintentional drug overdose deaths occurred in the US in 2007, one death every 19 minutes.
- A big portion is due to Pain Killers (narcotics & opioid analgesics).
- Complications occur in older patients who take multiple medications due to various drug interactions.

As Baby Boomers approach Retirement Age, they’ll transform Aging in America
- 76 million boomers were born between 1946 and 1964. America wasn’t prepared for that growth, and neither were other nations.
- There weren’t enough hospitals or pediatricians, or schoolteachers, textbooks or playgrounds, or even bedrooms in our homes.
- The “baby boomer” generation is a huge demographic that has strained institutions every step of the way.
- Boomers are politically active and represent a substantial voting bloc. They had no voice as infants and children, but now they do.
- Average lifespan in 1940 was 63.5 years with some 9M Americans receiving Social Security.
- The ratio of workers to beneficiaries was 159 to 1.
- Average lifespan by 2010 was 78.3 years, and nearly 39M people received Social Security benefits.
- The ratio of workers to retirees was 2.9 to 1, but that was BEFORE the first boomer turned 65.
Seniors and those with unhealthy lifestyles consume more resources
- Preventable chronic conditions account for 90% of all health care spending. (HHS)
- 117M Americans suffer from multiple chronic conditions (CDC), including one in 15 children.
- 77% of people over age 65 live with two or more chronic conditions. (HHS)
- 66% of the total health care spending is associated with care for the over one in four Americans with MCC.
- About one-fourth of people with chronic conditions have one or more daily activity limitations that require help. (CDC)
- Nearly 70% of deaths result from non-communicable diseases today, and it will grow to 75% by 2025. (CDC)
- Heart disease, cancer and stroke account for more than 50% of all deaths each year. (CDC)
- Global cancer rates are expected to increase 50% to 15 million by 2020.
- 40% of cancers can be preventable.
- Seniors have more disabilities and thus need more care.
- 14.3M seniors 65+ have a disability (36.7% of the 39M senior population).
- 82% of people age 90-94 report have trouble doing errands, visiting a doctor’s office, climbing stairs or bathing versus 69% for ages 85-89 and 91% for age 95+.
- 5.3M Americans have Alzheimer’s today (12.5% of 65+, 43% of 85+), growing to 16M by 2050.
- We spend $172 billion/yr treating Alzheimer’s today, likely growing to $1.08 trillion/yr by 2050 with increased longevity and the number of cases.
- Alzheimer’s care can average 47hrs/wk/patient.
- 37M Americans have a disability (It’s not just seniors but 11.9% of the 304M total US population).
- Arthritis is the most common cause of disability, with nearly 19M Americans reporting activity limitations from Arthritis.
- It costs significantly less to Prevent medical conditions than to Fix them. (need statistic)
- Insurers are working to better coordinate care so seniors stay healthy longer.
- Many employers now provide wellness programs to keep workers healthy and productive.
Obese and Overweight People have Less Fun, More Pain, Die Earlier, Earn Less, and Cost More

Much of this data is from the infographic, America’s Obesity Epidemic.
- Obesity has become the Largest Threat (excuse the pun) to the health, welfare and future survival of this country.
- 69% of adults (78M or more than 2 out of 3) are overweight, and over one third are obese.
- If obesity trends continue, by 2030, 13 states could have adult obesity rates above 60%, 39 states could have rates above 50%, and all 50 states could have rates above 44%. The result is Misery and Economic Costs.
- $190 billion, or 21% of our annual medical spending, goes to obesity-related illness, because weighing too much increases your risk for chronic diseases such as hypertension, type 2 diabetes, high blood pressure, coronary heart disease, asthma, sleep apnea, and other serious illnesses.
- >$300 billion/year is the 2018 estimate if we continue on our current path.
- As businesses lose another $4.3 billion due to obesity-related job absenteeism and another $70 billion in lost productivity, they off-shore jobs to avoid rising health costs and thus contribute to our economic decline.
- With more of our taxes going to Healthcare, less is available for our Education, Fire, Police and Armed Forces.
- 1 of 3 children are overweight or obese (18% are obese). To do Nothing is to sentence kids to death or a life of pain and discomfort.
- Obese adolescents aged 12-19 years increased from 5% in 1980 to 18% in 2008.
- Only 10% of parents seek medical help for their obese children.
- Kids obese by age 10 will die 19 years earlier with diminished quality of life.
- About half of obese teenage girls will become morbidly obese by age 30.
- 1/3 of children born since year 2000 will develop diabetes.
- Children now consume >7.5 hours of media a day and are subjected to advertising that promotes the most Profitable foods.
- Up to 34% of adolescents skip breakfast every day.
- In 2008, just 18% of children in grades 9-12 got an hour of physical activity daily since no federal law requires physical education (PE).
- Just 4% of US elementary schools, 8% of middle schools, and 2% of high schools provide daily physical activity or education.
- It’s Much, Much better to Prevent obesity and related health problems than to care for them later.
- Physical activity – Less than 19% of Americans get the recommended amount.
- Fewer adults Walk to work (4.1% in 1977; 2.8% in 2008), and over 75% now Drive (up 300% since 1960).
- Jobs requiring even moderate physical exertion plummeted from 50% to 20% in the last 50 years.
- Fewer kids walk to school (20.2% in 1977; 12.5% in 2001). Over 80% are now driven while in 1969 42% walked or biked.
- High school kids spend less time in phys-ed classes (41.6% in 1991; 33.3% in 2009)
- Moderate behavior changes could Prevent more than 90% of type 2 diabetes, 80% of coronary artery disease, 70% of stroke, and 70% of colon cancer. (Harvard epidemiologist Walter C. Willett)
- About 26M adults & children have diabetes, 79M are pre-diabetic, and every 10 seconds a person dies from diabetes related causes.
- Obese people are 83% more likely to develop kidney disease.
- As many as 25% of American adults have excess fat in their liver.
- Overweight & obese people are 80% more likely to develop dementia.
- 20% of cancer deaths in women and 14% in men are due to obesity.
- Some 60M Americans have asthma and/or allergies.
- Over two-thirds of people with arthritis are overweight or obese.
- CDC body mass index (BMI calculator) for ages 20+ estimates your body fat as a ratio of weight & height.
- Underweight (less than 18.5)
- Healthy weight (18.5 – 24.9)
- Overweight (25 – 29.9)
- Obese (30 and above)
- Morbidly Obese (40 and above)
- Our DNA has not changed as we consume more calories and burn less, but our Environment has. As hunters & gatherers, we ate all of our kill, not knowing when we might eat again. But today we grow or raise our food and eat any time we want, but we still eat all that’s presented to us, even as portion sizes grow.
- Sugar-sweetened beverages (and juices) became the largest source of sugar in our diets as consumption increased 135% since 1977.
- Profit margins for soft drinks are about 90%, compared to just 10% for fresh produce.
- The cost of soft drinks rose less than inflation between 1985 and 2000 (~20%) while the cost of fruits and vegetables rose 117%
- $30-40 billion/year in farm subsidies are costing hundreds of billions in healthcare costs.
- As over 75% of government subsidies go to the largest companies, nearly 50% of US farmland is planted with corn & soy, only 3% is planted with fruits & vegetables, and family farms are going under.
- Restaurant revenues increased from $43 billion in 1970 to $558 billion today, and portion sizes have dramatically.
- Coke: 20 oz / 250 calories versus 6.5 oz / 85 calories 20 years ago
- French Fries: 6.9 oz / 610 calories versus 2.4 oz / 210 calories 20 years ago
- Pizza slice: 4 oz / 425 calories versus 1.5 oz / 250 calories 20 years ago
- It’s cheaper to eat an unhealthy diet. Just compare these options at McDonald’s:
- McDouble ($1.00 / 390 calories) versus Southwest Salad ($3.79 / 140 calories)
- Large Coke ($1.00 / 310 calories) versus Bottled Water ($1.19 / 0 calories)
- Globesity – The Global Fight Against Obesity is a report from Merrill Lynch Global Research. Highlights:
- “Global obesity is a mega-investment theme for the next 25 years and beyond. Obesity may be the most pressing health challenge facing the world today and efforts to tackle it will shape thinking by policy makers and in boardrooms around the world.”
- Globally, 500 million people are obese and 1.4 billion are overweight.
- Obesity is the fifth greatest cause of death, leading to 2.8 million fatalities each year.
- Worldwide prevalence of obesity doubled between 1980 and 2008.
- By 2030, 65 million more Americans will be obese if current trends continue.
- While its impact is well-known in the West, obesity is rising quickly around the world.
- Obesity in Europe has tripled in 30 years.
- It is growing rapidly in emerging markets as diets westernize.
- Brazil, where 16 percent of the population is obese, is on track to match U.S. obesity levels by the 2020s.
- Obesity has reached levels of up to 20 percent in Chinese cities.
- A quarter of Russian women are obese.
- The costs of managing obesity are much greater than previously believed.
- In May 2012, U.S. annual cost of obesity-related illness exceeded $190 billion, equal to 21% of annual medical spending. Previous studies estimated 10%.
- Medical costs for treating obese patients are 40% higher than for non-obese patients.
- Treating obese patients comes at a higher premium than treating smokers.
- Obesity adds 50% to annual medical costs, while smoking adds 20%.
- High levels of global childhood obesity and growing obesity in emerging markets will further increase global costs.
- Direct relationship between poverty and obesity.
- 15.1% (46.2 million) Americans live in poverty, including 22% of our children. 20% live in extreme poverty. (2010 census)
- 3.2 million were kept out of poverty by unemployment insurance; 20.3 were kept out of poverty by social security.
- The poverty threshold for a family of four is $22,113, and the 2010 average income of the bottom 90% was $26.364.
- $6,298 — The decline in median working-age household income from 2000 to 2010.
- 49.1 million — The number of people under 65 without any health insurance.
- 13.6 million — The decline in the number of people under 65 with employer-sponsored health insurance from 2000-2010.
- Public health officials can accurately predict obesity and longevity rates by zip codes. One inner city example had an average lifespan of just 64 years while it was 90 years in a wealthier neighborhood just 8 miles away.
- Disadvantaged communities are at higher risk for many preventable health conditions, including obesity, diabetes, heart disease, asthma, HIV/AIDS, viral hepatitis B and C, and infant mortality.
- That’s partially due to the lack of fresh and nutritious food at affordable prices and the lack of sidewalks and parks that encourage exercise.
- Pressures from Job, Money, Divorce and Violence cause a vicious cycle of Stress = Obesity = Stress … (Exercise helps relieve that stress.)
- About Poor Women (living below the poverty line)
- Over 24M Women were poor in 2009 (US Census)
- Single Mothers are TWICE as likely to be poor as single Fathers (AmericanProgress.org)
- Women make on average $0.77 for every dollar a man makes (US Census)
- 27.5% of Black women were poor in 2009, versus 27.4% of Hispanic and 13.5% of White women (US Census)
- Women are more likely to be poor than men across all racial & ethnic groups (AmericanProgress.org)
- Elderly Women are more likely to be poor than elderly men. In 2008, 13% of women over 75 were poor, compared to 6% of men over 75. (AmericanProgress.org)
- In 2008, 54% of poor women were SINGLE without dependent children (AmericanProgress.org)
- Poor Women are more likely to be diagnosed with Depresion and other mental health disorders (American Psychological Association)
- 54% of women ages 18-34 have struggled to afford Birth Control at some point (The Daily Kos)
- Poor women are more likely to experience postpartum depression and to deliver premature babies (American Psychological Association)
Health Care places a Heavy Burden on 65M unpaid family caregivers
- 78% of seniors needing long-term care receive it from family or friends.
- Many Boomers spend more years caring for aging parents than a child.
- They spend an average of 20hrs/wk caring for a loved one and often feel overwhelmed.
- One-in-5 employees age 45-74 must quit work for caregiving.
- Caregivers will spend an average of $509 annually for each person they tend to by 2021, a 69 percent increase from 2016, according to research by the AARP and consultants Parks Associates. But that doesn’t consider lost worker productivity.
- 3 of 4 caregivers want to use technology to make their duties easier, but only 7% have actually done so. (AARP and others)
- The long-distance caregiver burden averaged about $8,728 in 2007, far more than caregivers who lived close to their loved one. (National Alliance for Caregiving and Evercare, a division of United Health Group)
- The 2009 annual cost was $480B/year in unpaid family caregivers’ lost worker productivity, reduced earning capacity & retirement income, as well as increases in caregiver’s own physical & emotional health and related costs. That’s about 3.2% of the U.S. GDP ($14.1 trillion in 2009), more than the $361B in Medicaid spending, and nearly as much as the $509B in Medicare spending.
- That annual cost is now up to $522 billion, per 2016 Rand Corp. estimates.
- By 2020, 45 million Americans will be caring for 117 million seniors.
- By 2033, the first boomers will turn 85 and start needing care themselves, and that’s when the demographics will really hit healthcare costs.
- See also: Who Will Care for the Caregivers? (NY Times)
Medicaid and Nursing Home Statistics (unconfirmed)
- There’s a 65% chance that seniors over age 65 will become dependent on caretakers as they unable to complete at least two “activities of daily living” such as dressing, bathing or eating. That need often forces them into nursing homes, but that’s expensive, averaging over $83,000/year for a private room. (MetLife) Even Assisted Living facilities are expensive, with a base rate average of $41,000.
- Medicare is a social insurance program funded entirely at the federal level for seniors age 65+. It covers hospital bills, medical insurance coverage, and prescription drugs, but NOT long-term care, including that in a nursing home. Nursing home care may be covered for only 100 days per benefit period after a three-day hospital stay, where 20 days are covered at 100% and days 21 to 100 require a co-pay.
- Medicaid is a means-tested federal/state program that provides health coverage or nursing home coverage to certain categories of low-asset people, including children, pregnant women, parents of eligible children, people with disabilities and elderly needing nursing home care. On average, the federal government pays 57% of Medicaid expenses. Medicaid payments currently assist nearly 60% of all nursing home residents and about 37% of all childbirths in the US. (Wikipedia)
- Only 49% of nursing home costs were covered by Medicaid in 2002. 25% was paid out-of-pocket, and 7.5% was covered by private insurance.
- 40% of individuals who reach age 65 enter a nursing home at some point, and the average age upon admission was 79. 38% will eventually be discharged to go home or to another facility. 10% will stay there 5 or more years.
- 25% of all US deaths occur in nursing homes, an amount that could rise to 40% by 2020, and 65% of nursing home residents die within one year of admission.
- 42% of nursing home residents have some form of dementia. 33% experience depression.
MORE STATISTICS FOLLOW THE CHART BELOW

The Home Health Care Opportunity:
“We can save Trillions by moving at least 50% of healthcare services from institutions to homes.” (Eric Dishman, Intel)
- Boomers have a “fierce” desire to remain independent, which will lead to an expansion of organizations offering home- and community-based care. >90% of people 65+ want to age at home if safe as long as possible. (AARP )
- Avg. Nursing Home private room = $230/day, or $83,950/yr (Genworth)
- Avg. Assisted Living = $3,450/mo, or $41,400/yr (Genworth)
- Avg. Independent Living Community = $32,000/yr (Long Term Living Magazine)
- Avg. In-Home Care = $18,000/yr (health aid, meals on wheels, maid, etc.)
- Avg. In-Home Non-Medical = $19/hr (bathing, dressing, cooking, errands)
- Avg. adult daycare = $65/day (social, non-medical, community-based setting for some part of the day)
- 70% more home aid jobs will be needed by 2020, long before the bubble appears. (Bureau of Labor Statistics)
Filling those home aid positions will be difficult with average pay of just $10/hr.
- The Texas Money Follows the Person program saved $116B already by moving 2029 out of nursing homes.
- They research their own conditions and want more control over their health care in partnership with care providers.
- They seek customized insurance and care plans tailored to their needs. They comparison shop, check with their peers, and will change plans if they find something better.
- Their increased demands will drive more competition and accelerate innovation.
- More than 80% of Americans 18 and older are online. (Pew Internet)
- Senior (65+) use of Internet has grown rapidly, from 19% in 2008 to 40% in 2010 and 53% in 2012. Half search for health info online.
- Once seniors are logged on, the Internet tends to become a fixture of daily life, including accessing social networks like Facebook to keep up with family and friends.
- Seniors are also social. 2/3 of those 65+ with PCs communicate with Family & Friends by email, and they represent the fastest growth in social media adoption, growing from 25% to 47% between April’09 and May’10.
- However, adults over age 75 are much less interested in using the Internet, which is why Modern Health Talk targets their adult children who are more likely to go online to find tech solutions for their parents.
- Although awareness of Assistive technology is low (other than security systems), 78% of US consumers expressed interest in mobile health solutions.
- 35% of U.S. adults have gone online to figure out a medical condition. Of those, half went on to see a medical professional. (PEW)
- Half of health information searches are conducted on behalf of someone else. (PEW)
- 80% of Internet users say that their last health-related search began at a search engine, rather than a health-specific site like WebMD (13%). Only 1% started at a social network like Facebook. (PEW)
- Global Home Healthcare market = $40.5B in 2009, growing to $67B by 2016 (GBI Research)
- US Digital Health market = $5.7B by 2015 with 55% CAGR (Parks Associates)
- US Home Remote Monitoring = $295M by 2015 (Frost & Sullivan)
- US Remote Patient Monitoring = $7.1B in 2010, with 25.4% ACGR and 2015 estimate of $22.2 billion (Kalorama Information)
- Health & Fitness Apps market = >$400 million in 2016 (ABI Research)
- North America Home Healthcare Market = $90.9 billion in 2012, poised to grow at 7.5% CAGR to $130.4 billion by 2017. (WSJ)
- Global mHealth market (combining mobile & health technologies) = $23B by 2017, U.S. mHealth = $5.9B by then (HealthTechZone)
- >100,000 mHealth apps (Q1 2014, per research2guidance.com). The number of mHealth apps published on the two leading platforms (iOS & Android) has more than doubled in the last 2.5 years.
- Market revenue reached $2.4B in 2013 and is projected to grow to $26B by the end of 2017.
- With over 72% of the globe connected via mobile technology and over 60% of US physicians owning tablet devices, the promise of mobile health to profoundly impact, on the delivery of healthcare cannot be understated.
- Most of these physicians are using iPads and about half of all tablet-toting physicians use the devices at the point of care.
- What’s the Future of Mobile (slide deck): Is it Android? Microsoft? HTML5? Or does Apple take over the world?
- Asia Pacific mHealth market = $7B by 2017 (GSMA)
- Medical/health apps = 3rd fastest-growing, with 60% aimed at consumers vs. health professionals
- Remote Patient Monitoring provides Undeniable Benefits (Philips Healthcare):
- 89% of agencies reported an increase in quality outcomes
- 76.6% cited reduction in unplanned hospitalizations
- 77.2% cited reduction in ER visits
- 76% reported patients improving self care by proactive disease management
- Advanced patient monitoring represents a US market forecast to reach $20.9 billion by 2016, up from $3.9 billion in 2007 and $8.9 billion in 2011, according to a study by Kalorama Information.
- Medication Management devices can regulate the home environment for Safety. AARP recommends them.
- Devices that let family/friends know you’re OK or need help = 46% of 65+, 18.5M people, $925M oppy.
- Electronic Pill Box Reminder = 29% of 65+, 11.7M people, $583M oppy.
- Electronic Pill Box w/ Alert = 20% of 65+, 8M people, $402M oppy.
- Device to send vitals to medical staff = 25% of 65+, 10M people, $502M oppy.
- HA devices to control Lights, Stoves, Thermostats = 48% of 65+ population, 19.3M people, $950M oppy.
- >20% of 65+ population uses home safety technologies.
- Home TeleHealth market = 60.3 million US households by 2015 (IDC)
- Available monthly budget varies: 40% <$50/mo, 25% $50-$99/mo, 10% $100-199/mo, few > $200/mo.
- U.S. Health Care Fraud is conservatively estimated at over $80 billion per year. (CNBC’s Health Care Hustle series)
- Home Health Care is a $85 billion industry. (NPR)
- Home health care agencies typically charge about $18/hour, while their caregivers get just $8-9/hour.
- Most home care services are non-medical, including things like assistance with bathing, dressing, shopping, cooking, etc.
- Most non-medical home caregivers get no overtime pay or benefits, unlike those in nursing homes doing similar work.
Tech savvy boomers are sophisticated shoppers and purchasers of health care.
- They research their own conditions and want more control over their health care in partnership with care providers.
- They seek customized insurance and care plans tailored to their needs. They comparison shop, check with their peers, and will change plans if they find something better.
- Their increased demands will drive more competition and accelerate innovation.
- 75% of all Americans are online, and half of those 65+ search for health info online.
- Senior use of Internet has grown rapidly, from 19% in 2008 to 40% in 2010.
- Seniors are also social. 2/3 of those 65+ with PCs communicate with Family & Friends by email, and they represent the fastest growth in social media adoption.
- Baby Boomers represent over half of online adults and are divided into 4 segments.
- Although awareness of Assistive technology is low (other than security systems), 78% of US consumers expressed interest in mobile health solutions.
- Tablets – Physician adoption almost doubled since 2011, reaching 62% in 2012, with iPad being the dominant platform. (Manhattan Research)
- Tablets – Consumer adoption is a bit slower, with 19% of adults owning tablet computers by January 2012. (Pew Internet)
- Physicians with 3 screens (tablets, smartphones & desktops/laptops) spend more time online than physicians with one or two screens.
Use the comments below to let us know of updates, errors, new stats, or to share your insights.
i like this article it has a lot of valuable info, Thanks for sharing all of the great statistics
How Does the US Healthcare System Compare to Other Countries?
According to the latest OECD statistics, summarized by the Peter G. Peterson Foundation, the US spends twice as much on healthcare as other advanced nations, either as a percent of GDP or per capita. But it lags on significant measures of outcome, including life expectancy, infant mortality, asthma, and diabetes.
WHY? Utilization rates in the US don’t differ much from other wealthy OECD countries, so Higher Prices appear to be the main driver of the cost difference. Also see my article, Why American Healthcare is So Expensive.
RELATED ARTICLES:
As the World Ages: When Older Populations Become the Majority — This well-researched and well-written article by PEW Charitable Trusts hits most of the issues of aging populations but misses a few:
AGE DISCRIMINATION – It prevents qualified seniors from finding jobs that pay what they’re worth, or any job at all. That can force them into early retirement where they spend-down retirement, greatly affecting wealth accumulation.
HEALTH SPAN – We often talk about living longer (longevity or lifespan), but along with that come increased chronic illness and frailty unless we also talk about health span. We cannot accumulate wealth if we’re unable to work because of poor health.
WORKER:RETIREE RATIO – The average lifespan in 1940 was 63.5 years with some 9M Americans receiving Social Security, and with aratio of workers to beneficiaries was 159 to 1. By 2010, the average lifespan was 78.3 years with nearly 39M people receiving Social Security benefits, and a ratio of workers to retirees of 2.9 to 1. But that was BEFORE the first boomer turned 65, and now 11,000 turn 65 every day.
POLITICAL INFLUENCE – The “baby boomer” generation is a huge demographic that strained institutions every step of the way. They had no voice as infants and children, but now they do, and they are politically active and represent a substantial voting bloc.
INEQUALITY – Retirees who had good careers, a good pension, and invested well are one thing, but more than half of the nation lives hand-to-mouth and collectively owns less than 0.5% of stocks. They didn’t and don’t invest, and they rely on Social Security as their primary or only source of income. The problem with rising inequality is that it leads to unequal political influence and unfair opportunity as well, and that threatens our democracy. (See https://www.mhealthtalk.com/inequality/)
Humanity is going into a massive decline. That’s a problem. (July 2020) “Everything is starting to change.”
Global Trends Driving Healthcare Transformation (Wall Street Journal)
A Growing American Crisis: Who Will Care for the Baby Boomers? (TIME, 2/15/2019)
“Silver Tech” Is The Young Hot Growing Tech Trend For Seniors (Forbes, 7/`5/2020) My comment: While the “Silver Tech” trend is exposed by a global pandemic and need for telehealth, telework, and social distancing, it’s largely driven by a change in demographics as our parents (the Greatest Generation) die off.
Hi,
Thanks for all of the great statistics. Can you provide a listing of the journals or articles where you obtained the statistics from?
Based on reading your site, you highlight a lot of advantages for aging-in-place. Do you have any thoughts on the Maine Approach?
Ravi, While some stats include a link to their source, many others don’t. However, you can usually find a source by Googling the stat itself. If there’s one in particular that you can’t find, let me know and I’ll see if I can find it for you.
By the “Maine Approach,” I assume you’re referring to Dr. Allen Teel’s book, “Alone and Invisible No More: How Grassroots Community Action and 21st Century Technologies Can Empower Elders to Stay in Their Homes and Lead Healthier, Happier Lives.” Teel suggests the Maine Approach works best on a community by community basis rather than as a large, state or multi-state system, and I agree, since each community and personal situation is different, and not all can support his approach. The Maine Approach is very tech-dependent and uses Skype, video-conferencing, broadband Internet, and WiFi to allow home-bound elders to virtually attend club meetings, interact with family living far away, or consult with healthcare providers. I like the role of community-wide volunteers and his work in getting senior discounts for Internet access and computer equipment.
These related articles describe a similar vision by Henry Cisneros, who used to be the mayor of San Antonio and then the HUD Secretary under Clinton, and his book, “Independent for Life: Homes and Neighborhoods for an Aging America.”